
Two weekends ago, on a Friday, my droplet was automatically upgraded to DigitalOcean‘s new cloud. I had received an email about the upgrade but had ignored it, believing that the upgrade would go smoothly. I was on a trip that Friday and the weekend, so did not check my website until Monday morning. Unfortunately, my website was unreachable and had been so since Friday.
Droplet Up, Website Down
 I logged into DigitalOcean and the web interface said that my droplet was up and working fine. However, I could not ping it or secure shell to it. DigitalOcean’s Console Access web interface did worked and showed the necessary processes running on my droplet. The droplet was working fine but network access to it appeared to be broken.
I contacted support and was eventually routed to second level support (an engineer) who told me that I had to manually power off (run “sudo poweroff” on the command line) and then power on the droplet (using DigitalOcean’s web interface). This fixed the network connection issue and my website was back online. Note that doing a “shutdown -r” command or a “Power Cycle” (using the web interface) did not fix the connectivity problem.
DigitalOcean support was very responsive. Of the three support cases I’ve opened in the year that I’ve been with them, first line support had responded promptly. Of course, support did make use of canned responses (which I didn’t object to because it made sense to filter out beginners). Though I was vexed by the network connectivity issue (my website was offline for 3 days) and my irritation showed in my communications, the support staff always remained very polite and gracious.
Doing such a system-wide upgrade without checking network connectivity to affected droplets concerns me. Checking that upgraded droplets are up and reachable would have been my first validation test after the upgrade, instead of putting the burden on the customer to make sure everything is okay. Then again, this expectation might be acceptable for an unmanaged VPS; though I think it is a grey area because the upgrade was initiated by DigitalOcean. For full disclosure, DigitalOcean did provide a manual upgrade process; which in hindsight, I should have taken advantage of. Lesson learned.
Slow and Slowerer
When I configured my droplet a year ago, I was very impressed by the performance. My website loaded pages within 1 second, as opposed to the 2-4 seconds on my previous shared web hosting service. Recently, I would have been very glad to get back my 2-4 seconds page load time.
Since the past few months, I’ve noticed my website getting slower and slower. Even a simple PHP application I had running (also on the droplet) took longer and longer to process. Like a frog slowly being boiled, I got used to a 4-6 seconds page load time as being “normal”.
Worse, after my droplet was upgraded, the page load time dropped to 8-9 seconds. I installed the “WP Super Cache” WordPress plugin in a quick fix attempt to increase performance and it worked. Once WP Super Cache was activated, page load times moved back to 4-6 seconds.
You know what they say about quick fixes. A week later, the page load times increased to 8-15 seconds. 15 seconds! I disabled WP Super Cache and page load times dropped to 4-6 seconds. I didn’t understand why but at least, the crisis was averted.
Bottleneck? What Bottleneck?
The performance of any VPS (or shared web hosting) is determined by the allocated CPU power, amount of memory, disk access speed, software stack (programs running), and network traffic. The first three can be collectively known as the hardware or virtual hardware. In my website’s case, the software stack is composed of the Ubuntu operating system, LEMP infrastructure, WordPress and its plugins. And though I would love to say that the slowdown was due to increased network traffic to my website, it wasn’t.
When optimizing for performance, it pays to determine where the bottleneck is. For example, you could waste time optimizing the LEMP (by adding Varnish) or WordPress (by adding the WP Super Cache plugin) when the bottleneck is that you are out of memory (Varnish won’t help) or free disk space (WP Super Cache could actually make this worse with its caching mechanism). Having said that, there are ways to optimize LEMP (and WordPress to a lesser extent) to reduce memory usage; but then, it is usually at the cost of performance.
I contacted DigitalOcean support for help. I got a mostly canned reply back. They stated that the fault wasn’t because of network connectivity, hardware, or over-subscription (where there are too many droplets running on the same physical hardware). They had tested loading a couple of static images from my website, which only took 100-200ms each and proved that the problem was not on their end. The canned reply suggested using sysstat to figure out the problem with the droplet.
Sysstat is a collection of utilities to monitor performance under Linux. Here’s how to install and use sysstat:
sudo apt-get install sysstat
# Enable sysstat system metrics collection
sudo vi /etc/default/sysstat
# Change ENABLE="false" to "true"
# Start sysstat
/etc/init.d/sysstat start
# Check CPU usage
sar -u
# Check memory usage
sar -r
Because we have just started the sysstat process, the check CPU and memory usage will only return the current CPU and memory usage. Sysstat will collect system metrics every 10 minutes; so in the future, the “sar” commands above would return the CPU and memory usage collected every 10 minutes in the past. Sysstat has a lot more functionality which I have yet to explore.
My favorite performance monitoring tool is the “top” command. It displays a real-time summary of the CPU, memory, and swap usage with a list of the processes consuming the most CPU. (Note that the Ubuntu image from DigitalOcean has swap disabled by default.) The top command allows me to see what is happening on the system as I load a page.
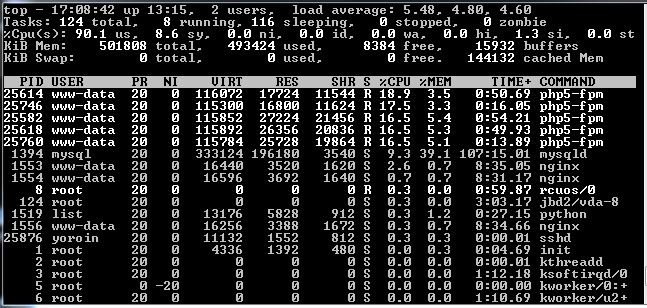
Right off the bat, I noticed that my CPU usage was around 90% constantly, which was a big red flag. After a day of recording, sysstat returned the same average 90% CPU usage. This might explain why the WP Super Cache plugin, which required more CPU and disk access to do the page caching, made the website performance worse. I didn’t recall seeing the CPU that high when I first configured the droplet a year (it would have concerned me very much then).
Memory also looked alarming with a 98% usage (493424 used / 501808 total); however, it was a false alarm. Evidently, Linux operating systems like Ubuntu will allocate all the free memory for disk caching. Then, when applications need more memory, they get it from the disk cache. So, the important data to look for is the cache size. Here, the cache size was 28% of total memory (144132 cached Mem / 501808 total), which means only about 2/3 of memory was actually used by applications.
Note: The Linux command to display free memory, “free -m”, supports the same conclusion. Look for the reported “cached” number.
What Is Eating My Hard Drive?
Running the Linux command to report file system disk space usage, “df -h”, indicated that 93% of my 20GB quota was used. I remembered that my droplet used much less than 50% of the 20GB a year ago.
Find the space hogs:
sudo du -h --max-depth=1
16G ./var
cd var
sudo du -h --max-depth=1
6.0G ./www
7.4G ./lib
2.0G ./log
Note: If your system’s estimate file usage “du” command does not support the “max-depth” flag, then you will need to run this command on each directory one by one like so:
sudo du -sh /var/lib
sudo du -sh /var/log
The “/var/www” directory contained my website content so that was a keeper. The “/var/lib” directory contained important system and application files, so we could not just delete anything in it without a lot of caution. The “/var/lib” directory’s large size was caused primarily by the MySQL database file, “/var/lib/mysql/ibdata1”, which we will examine in detail later. I was certain that I could safely delete the archived log files from the “/var/log” directory though.
sudo /etc/cron.daily/logrotate
# Delete all gzipped archive files
sudo find /var/log -type f -name "*.gz" -delete
# Delete all next-to-be-archived files
sudo find /var/log -type f -name "*.1" -delete
# Double-check size again
sudo du -sh /var/log
563M /var/log
Strangely, I found the mail directory, “/var/mail”, taking up 150MB. There were a lot of non-delivery notification emails sent to the website address. (I don’t know why but plan to investigate it at a later time.) I was sure that it is also safe to delete those emails.
sudo du -sh /var/mail
156M /var/mail
# Truncate all mail files to zero size
sudo find /var/mail -type f -exec truncate {} --size 0 \;
# Double-check usage
sudo du -sh /var/mail
4.0K /var/mail
Note: I did read a recommendation to enable swap on Ubuntu to guard against out of memory errors (because swap allows disk space to be used as additional memory at the expense of performance); however, because I have 1/3 free memory and a performance problem, I don’t think enabling swap is the appropriate solution for my case.
Die, WordPress Plugin, You Die!
I strongly believed that the bottleneck was the CPU; the top five most CPU-intensive processes were the “php5-fpm” processes (responsible for executing PHP scripts). So, optimizing LEMP by adding Varnish (an additional HTTP accelerator process) would probably not help, and might even harm the performance further. What could be causing so much CPU usage?
According to Google Analytics, the traffic to my website had not changed significantly this past year. Even if it had, the now roughly 200 visitors per day should not cause such a high CPU usage. I had not changed my website in any way (for example, by adding new plugins). The only changes had been software updates to Ubuntu, WordPress and its plugins.
For LEMP infrastructure issues, the recommended step is to check the log files for errors.
sudo tail /var/log/dmesg
# Nginx log
sudo tail /var/log/nginx/error.log
# PHP log
sudo tail /var/log/php5-fpm.log
# MySQL log
sudo tail /var/log/mysql/error.log
Looking at the Nginx log was eye-opening because I could see hacking attempts against my website using invalid URLs. However, that could not be the cause of the high CPU usage. There were no other errors or clues in the log files.
For WordPress performance issues, the universally-recommended first step is to disable the plugins and see if that fixes the issue. Rather than disabling all the plugins and re-enabling them one by one, my gut told me that the culprit plugin might be the “WordPress SEO”. When I get daily-in-row or even twice-a-day updates to a piece of software, I know that the software is very buggy. WordPress SEO was guilty of that behavior. Disabling the WordPress SEO plugin resulted in an immediate drop in CPU usage to the 30-50% range. Page load times dropped to 2-3 seconds.
Unfortunately, when I checked a few days later, the CPU was back up to 90% and page load times had increased back to 8-10 seconds. The WordPress SEO plugin was a contributor, but it was not the primary cause of my droplet’s performance issue.
MySQL, What Big Eyes You Have
In addition, the “/var/lib” directory had grown another 1.5GB in size and at a total 9GB, had consumed almost half of my 20GB allocation. Digging further, I found that it was the “/var/lib/mysql/ibdata1” file that had grown to over 6GB. The “ibdata1” file was where MySQL (specifically the InnoDB storage engine) stored the database data and while it can grow, unfortunately it can never decrease in size.
A MySQL query on the database size was necessary to investigate further. Log into MySQL as the root user and run this query to show the sizes of the existing databases:
sum( data_length + index_length ) / 1024 / 1024 "Data Base Size in MB",
sum( data_free )/ 1024 / 1024 "Free Space in MB"
FROM information_schema.TABLES
GROUP BY table_schema;
I found that my MediaWiki database was over 6GB in size. I had a MediaWiki for personal use. Access to it was restricted by a password-protected directory. I hadn’t used it in a long time (over half a year) so hadn’t paid any attention to it. When I logged into it, I found the main page was blank with a link to an unknown website. A check of the history indicated that multiple unknown revisions had been made to it since February of this year. My MediaWiki had been hacked.
Evidently, someone had gotten past the password-protection and was using the MediaWiki to store 6GB of data. Worse, that someone may have hacked MediaWiki to run their own PHP code (very unlikely but not impossible as I had a very old version of MediaWiki running). This explained the high CPU usage and the low free disk space.
I savaged my personal info from the MediaWiki (using the history to view old page revisions). I then deleted the MediaWiki database and directory containing the MediaWiki PHP code. The CPU usage immediately went down to a few percentages. Page load time dropped to around one second. Hurrah! (I also changed all my passwords just in case.)
MySQL Database Surgery
To reclaim the 6GB in space used by MySQL’s “ibdata1” file required major surgery. I needed to delete the “ibdata1” file which required deleting and re-creating the WordPress database (and my other personal databases).
Before starting, I recommend configuring MySQL to store each InnoDB table in its own separate file, instead of in the “ibdata1” file, to allow more options to manage drive space usage. Doing this will support the MySQL “Optimize Table” command, which can reduce the table’s file size.
# Add "innodb_file_per_table" to the [mysqld] section
[mysqld]
innodb_file_per_table
The change above won’t take effect until we restart MySQL.
We need to do some steps before and after deleting the “ibdata1” file:
mysqldump -u[username] -p[password] wordpress > /tmp/wordpress.sql
# Delete "wordpress" database (and any other database except "mysql" and "performance_schema")
mysql -u root -p
mysql> drop database wordpress;
mysql> quit
# Stop MySQL server
sudo service mysql stop
# Log into root user (necessary to access "/var/lib/mysql" directory)
su
# Delete subdirectories and files ("ibdata1") under "/var/lib/mysql" except for "/var/lib/mysql/mysql"
cd /var/lib/mysql
ls -I "mysql" | xargs rm -r -f
# Exit root user
exit
# Start MySQL server
sudo service mysql start
# Create "wordpress" database (and any other database)
mysql -u root -p
mysql> create database wordpress;
mysql> quit
# Restore "wordpress" database (and any other database)
mysql -u [username] -p[password] wordpress < /tmp/wordpress.sql
Viewing the “/var/lib/mysql” directory showed a much smaller “ibdata1” file (about 18M). Strangely, my WordPress database was configured to use MyISAM (an alternative storage engine to InnoDB) by default, so it didn’t use the “ibdata1” file. The “/var/lib/mysql/wordpress” directory contained MyISAM .myd storage files. However, my other personal database did use InnoDB and its directory, “/var/lib/mysql/personal_database”, did contain individual InnoDB .ibd storage files (per table).
WordPress On A Diet
While I was poking around WordPress, I decided to optimize the MySQL database by deleting unnecessary data such as previous versions of posts. Rather than manually truncating database tables myself (a very dangerous, though oddly satisfying pastime), I decided to use the “Optimize Database after Deleting Revisions” plugin, which did exactly what its name said it did.
Before running the “Optimize Database after Deleting Revisions” plugin, backup your WordPress MySQL database. Then do the following to manually optimize your database:
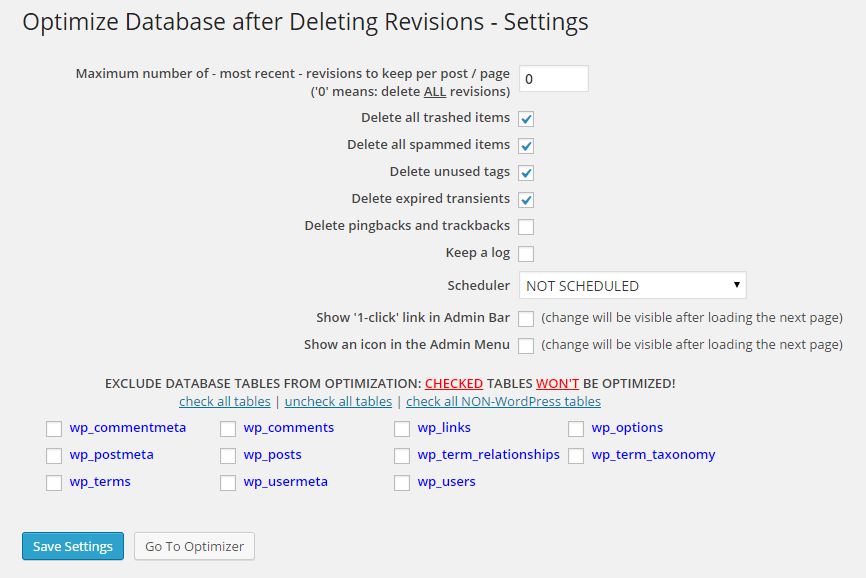
- Go to “Settings/Optimize Database” in the WordPress administration.
- Configured the options. I checked all the “Delete…” options except for “Delete pingbacks and trackbacks”. I did not enable the Scheduler because I only wish to run this plugin manually when I decide to.
- Click the “Save Settings” button.
- Click the “Go To Optimizer” button.
- Click the “Start Optimization” button.
Thoughts on Hardware Upgrade
Had I not fixed the high CPU usage issue (and it had been a valid issue), the next step would have been to look at options to upgrade the hardware. This would mean upgrading to DigitalOcean’s higher-priced plans or even another VPS provider (I have heard that Linode has better performance overall).
Because my bottleneck was the CPU, I would have had to upgrade to DigitalOcean’s $20/month plan which includes a 2 core processor. Upgrading to the $10/month plan, which only included a 1 core processor (the DigitalOcean website didn’t say whether it is a faster processor than the 1 core processor in the $5/month plan), would not have fixed my CPU issue. Had my bottleneck been a memory limitation, I would chose the $10/month plan, which would have doubled the memory size (1GB versus 512MB).
Thinking outside the box, a cheaper option than the $20/month plan would be to get a second $5/month droplet to run a dedicated MySQL server (hosting the WordPress database). The original droplet would run only the WordPress application and talk to the second droplet’s database. This $10/month option with two $5/month droplets would have two 1 core processors, which might be better than a single 2 core processor! Alas, the MySQL process used only 10-15% of the CPU so removing it from the original droplet would not have made much of a difference.
Hopefully documenting my trials and tribulations above will help you to have an easier time with the performance of your unmanaged VPS.
Some info above taken from: